Pictograms
A pictogram uses pictures to represent data.
Here we have a pictogram showing how many pizzas a shop sold on Monday, Tuesday, Wednesday and Thursday.
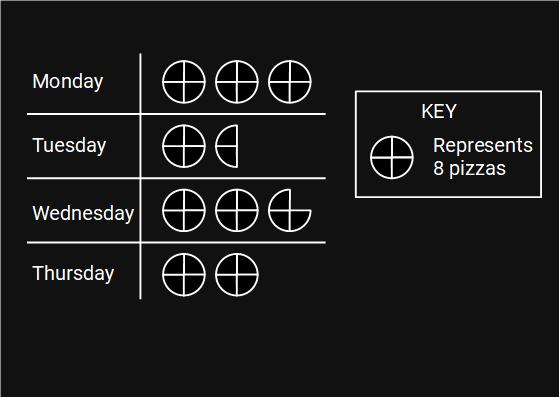
We can see from the key that each whole circle represents 8 pizzas.
On Monday there are three whole circles. Each whole circle represents 8 pizzas.
3 × 8 = 24
24 pizzas were sold on Monday.
For Tuesday there is one whole circle and half a circle.
Half a circle will be 4 pizzas (8 ÷ 2 = 4).
8 + 4 = 12
12 pizzas were sold on Tuesday.
For Wednesday there are two whole circles (2 × 8 = 16) and three quarters of a circle.
Each quarter of a circle is worth 2 pizzas (8 ÷ 4 = 2)
Three quarters of a circle represents 6 pizzas (3 × 2 = 6)
16 + 6 = 22
22 pizzas were sold on Wednesday.
For Thursday we have two whole circles.
2 × 8 = 16
16 pizzas were sold on Thursday.
24 + 12 + 22 + 16 = 74
In total 74 pizzas were sold.
Example
Here is a pictogram showing how many pies were sold on Monday, Tuesday and Wednesday.
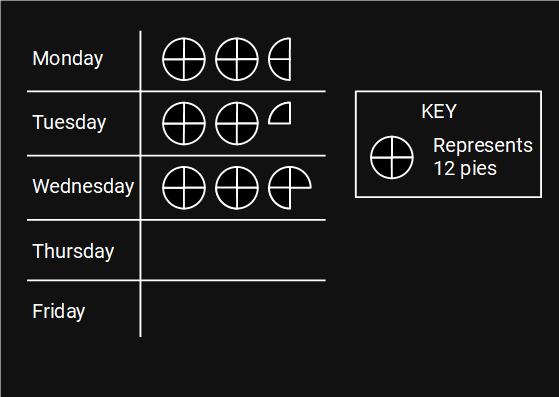
a) Write down how many pies were sold on Monday
We can see from the key that each whole circle represents 12 pies.
We have two whole circles which are worth 24 pies (2 × 12 = 24)
We also have half of a circle which will be worth 6 (12 ÷ 2 = 6) pies.
24 + 6 = 30
On Monday 30 pies were old.
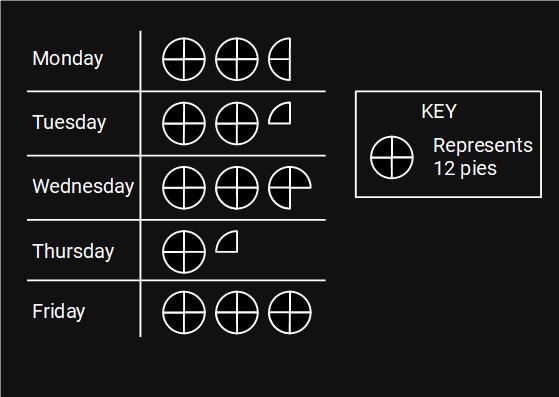
b) On Thursday 15 pies were sold and on Friday 36 pies were sold.
Use this information to complete the pictogram
12 pies are represented by a whole circle.
6 pies are represented by half a circle. 12 ÷ 2 = 6
3 pies are represented by a quarter of a circle. 12 ÷ 4 = 3
For Thursday we need 1 whole circle (12 pies) and 1 quarter circle (3 pies).
For Friday we need 3 whole circles (3 × 12 = 36)
Try this:
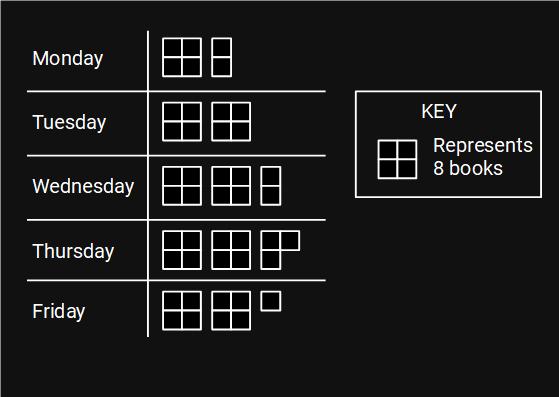
The pictogram gives information about the number of books sold by a shop on Monday, Tuesday, Wednesday, Thursday and Friday.