Revision notes for Edexcel IGCSE Maths Data. Open the guide for explanations and worked examples. Written against the Edexcel IGCSE Maths (4MA1) specification, so the content matches what's examinable rather than general Maths background.
Data
What you'll learn
- Summarise a set of scores using a middle value and a spread.
- Find the interquartile range, which measures the spread of the middle half of the data.
- Compare two groups using typical score and consistency.
- Work backwards with a class mean, which is the total divided by the number of scores.
1. Key data words
Data questions often ask you to describe a list of numbers without writing every value out. You usually need one number for the “typical” value and one number for how spread out the values are.
Definition
Key data words
-
A data set is a collection of values, such as test scores or points in games.
-
Ordered data means the values have been arranged from smallest to largest.
-
The mean is found by adding all the values and dividing by how many values there are.
-
The median is the middle value when the data is in order. If there are two middle values, the median is the mean of those two values.
-
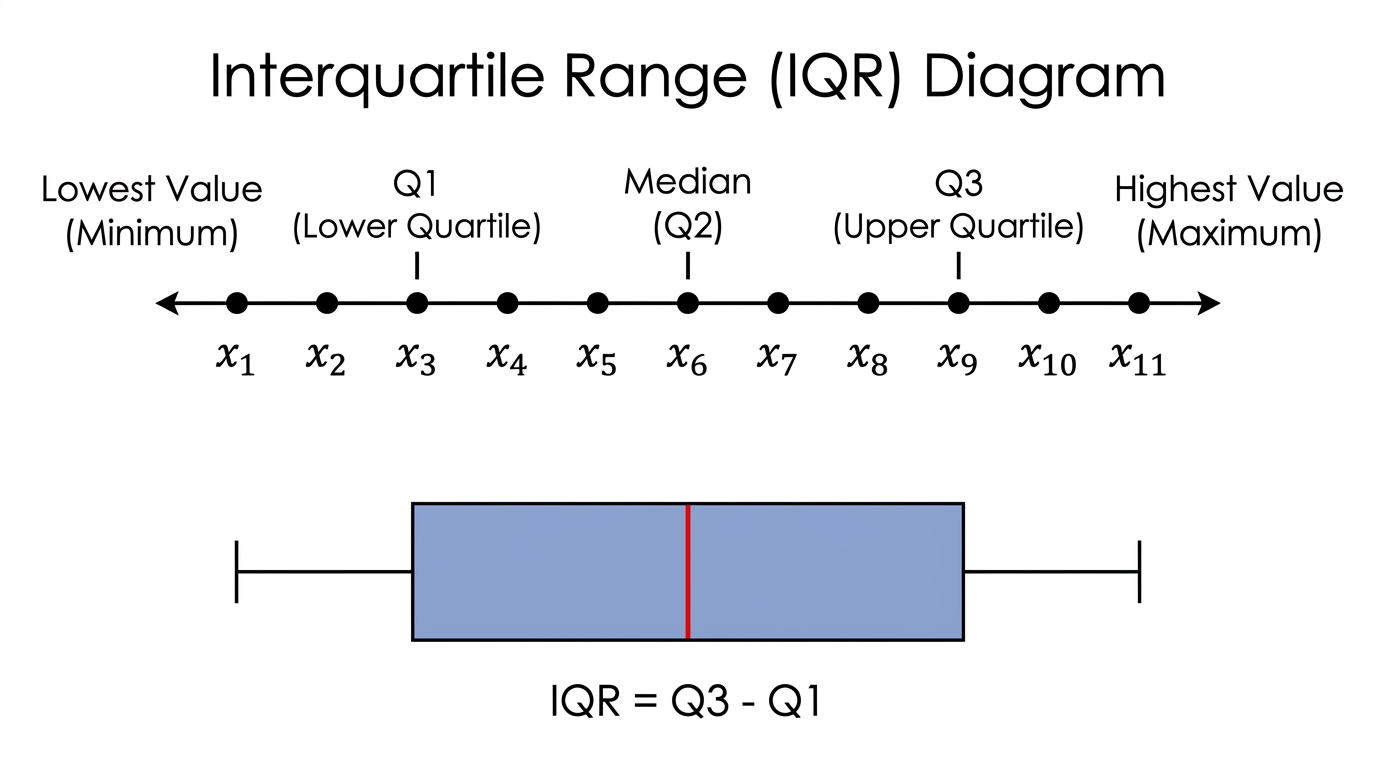
The lower quartile, written Q1Q_1Q1, is the middle value of the lower half of the data.
-
The upper quartile, written Q3Q_3Q3, is the middle value of the upper half of the data.
-
The interquartile range, or IQR, is Q3−Q1Q_3 - Q_1Q3−Q1. It measures the spread of the middle half of the data.
-
The range is the highest value minus the lowest value.
For 11 ordered values, the median is the 6th value. Then you find Q1Q_1Q1 from the 5 values below the median, and Q3Q_3Q3 from the 5 values above the median.
Key Idea
Spread and consistency
A smaller IQR means the middle half of the data is closer together, so the results are more consistent.
2. Finding the interquartile range
The most important first step is to put the data in order. If you do not order the data, the median and quartiles will usually be wrong.
Worked example: finding the IQR from 11 scores
A basketball player scores these points in 11 games:
19, 15, 21, 18, 24, 21, 16, 22, 20, 18, 25
Find the interquartile range.
Example
Finding the interquartile range
-
Put the scores in order from smallest to largest:
15, 16, 18, 18, 19, 20, 21, 21, 22, 24, 25
-
There are 11 values, so the median is the 6th value:
15, 16, 18, 18, 19, 20, 21, 21, 22, 24, 25
-
The lower half is the 5 values before the median:
15, 16, 18, 18, 19
-
The middle of the lower half is Q1=18Q_1 = 18Q1=18.
-
The upper half is the 5 values after the median:
21, 21, 22, 24, 25
-
The middle of the upper half is Q3=22Q_3 = 22Q3=22.
-
Subtract to find the interquartile range:
IQR=Q3−Q1=22−18=4\text{IQR} = Q_3 - Q_1 = 22 - 18 = 4IQR=Q3−Q1=22−18=4
Common Mistake
Forgetting to order the data
Never find quartiles from the list in the order it is given. Always sort the data first, even if the numbers look nearly ordered already.
3. Comparing two sets of data
When you compare two groups, you normally need two separate comments:
- one about the average or typical value, often using the median
- one about the spread or consistency, often using the IQR
If the median is higher, the typical result is higher. If the IQR is smaller, the results are more consistent.
Worked example: comparing test results
Two classes take the same quiz. The table shows the median and interquartile range.
| Class | Median score | Interquartile range |
|---|---|---|
| Red Class | 31 | 15 |
| Blue Class | 28.5 | 8 |
Compare the results of the two classes.
Example
Writing two comparisons
-
Compare the medians first. Red Class has a median of 31, while Blue Class has a median of 28.5.
-
Find the difference between the medians if it helps make the comparison clearer:
31−28.5=2.531 - 28.5 = 2.531−28.5=2.5 -
So Red Class had the higher typical score by 2.5 marks.
-
Now compare the interquartile ranges. Red Class has an IQR of 15, while Blue Class has an IQR of 8.
-
Blue Class has the smaller IQR, so Blue Class was more consistent.
-
A full answer could be: Red Class had the higher typical score, because its median was 2.5 marks higher. Blue Class had the more consistent scores, because its interquartile range was smaller.
Tip
Use the right words
For medians, use words like higher typical score or lower typical score. For IQR, use words like more spread out, less spread out, or more consistent.
Common Mistake
Thinking bigger spread means better
A larger IQR does not mean the group did better. It only means the results were more spread out. A smaller IQR means more consistent.
4. Combined means
The mean depends on both the total and the number of values. This means you cannot usually find a combined mean by simply averaging two separate means.
The key formula is:
total=mean×number of values\text{total} = \text{mean} \times \text{number of values}total=mean×number of valuesTo work backwards, find totals first, then divide by the correct number of values.
Key Idea
Weighted means
Groups with more people have more effect on the combined mean. Always use the group sizes as weights.
Worked example: finding a missing class mean
There are 24 students in Group A and 36 students in Group B.
The mean score for all 60 students is 70.4.
The mean score for Group A is 73.4.
Find the mean score for Group B.
Example
Finding the missing mean
-
Find the total score for all 60 students:
70.4×60=422470.4 \times 60 = 422470.4×60=4224 -
Find the total score for Group A:
73.4×24=1761.673.4 \times 24 = 1761.673.4×24=1761.6 -
Subtract to find the total score for Group B:
4224−1761.6=2462.44224 - 1761.6 = 2462.44224−1761.6=2462.4 -
Divide by the number of students in Group B:
2462.4÷36=68.42462.4 \div 36 = 68.42462.4÷36=68.4 -
The mean score for Group B is 68.4 marks.
Common Mistake
Averaging the averages
Do not do 70.4 and 73.4 halfway between each other. The groups have different numbers of students, so you must use totals.
5. Combined range
The range is the highest value minus the lowest value. If you are given the lowest value and the range for a group, you can find the highest value.
highest value=lowest value+range\text{highest value} = \text{lowest value} + \text{range}highest value=lowest value+rangeFor a combined range, you need the overall lowest value and the overall highest value.
Worked example: finding the range for two groups combined
In Group A, the lowest score is 41 and the range is 54.
In Group B, the lowest score is 36 and the range is 52.
Find the range of scores for both groups together.
Example
Finding the combined range
-
Find the highest score in Group A:
41+54=9541 + 54 = 9541+54=95 -
Find the highest score in Group B:
36+52=8836 + 52 = 8836+52=88 -
Choose the overall lowest score. The lowest values are 41 and 36, so the overall lowest is 36.
-
Choose the overall highest score. The highest values are 95 and 88, so the overall highest is 95.
-
Subtract to find the combined range:
95−36=5995 - 36 = 5995−36=59 -
The range for both groups together is 59.
Tip
Range shortcut
For combined range questions, write down each group’s lowest and highest value first. Then ignore the group labels and use the overall lowest and overall highest.
Exam technique
In the exam
-
Put raw data in order before finding the median, quartiles or interquartile range.
-
For comparison questions, write one sentence about the typical value and one sentence about spread or consistency.
-
For combined mean or range questions, do not combine the given summary numbers directly; change means into totals and change ranges into highest values first.
Self review
Check yourself
-
If two groups have the same median, what does the smaller IQR tell you?
-
How do you find Q1Q_1Q1 and Q3Q_3Q3 when there are 11 ordered values?
-
Why is 72+682\frac{72 + 68}{2}272+68 not always the combined mean of two classes?

Recap questions
Test yourself with 5 quick questions on this guide. Answer them all correctly to complete it.