Here is a conversion graph that can be used to change between Euros and Pounds.
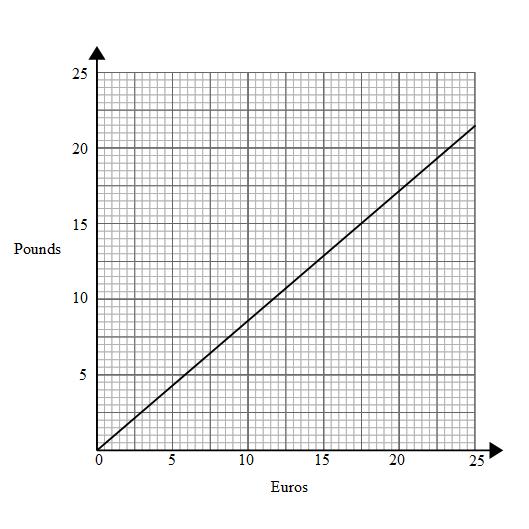
We can use the conversion graph to convert Euros into Pounds or Pounds into Euros.
Example: Use the conversion graph to convert €10 into Pounds.
We need to draw a straight line up (vertical) from €10 to the line on the conversion graph.
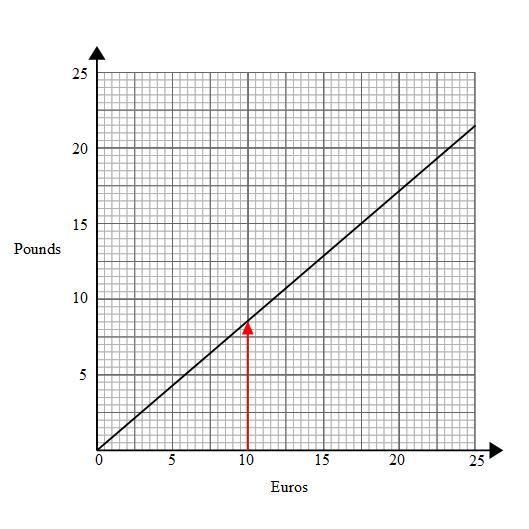
We then draw a horizontal line (across) from this point to the Pounds axis.
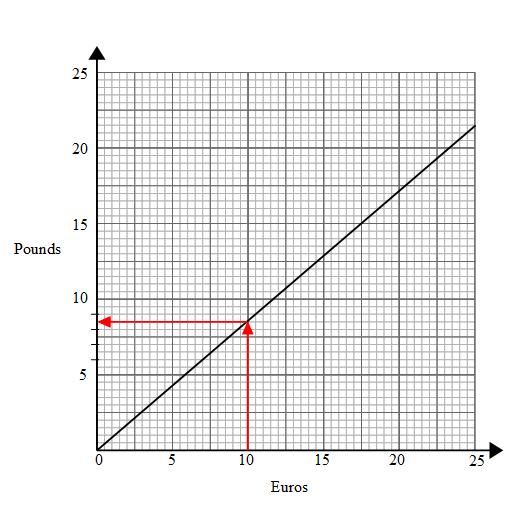
We now read off the scale. Half way between £8 and £9 is £8.50
€10 = £8.50
Example: Use the conversion graph to convert £18 into Euros.
We need to draw a straight line across (horizontal) from £18 to the line on the conversion graph.
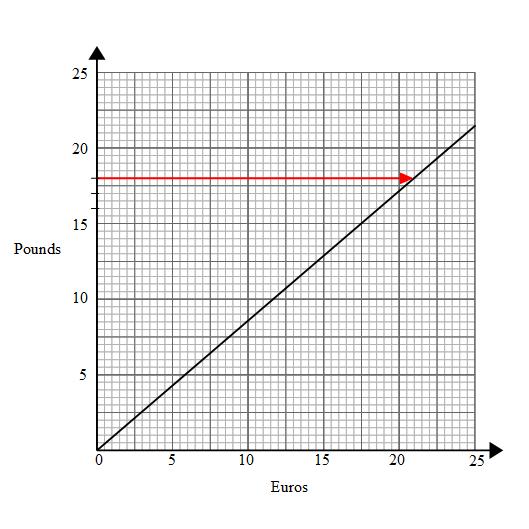
From this point we draw a vertical line down to the Euros axis
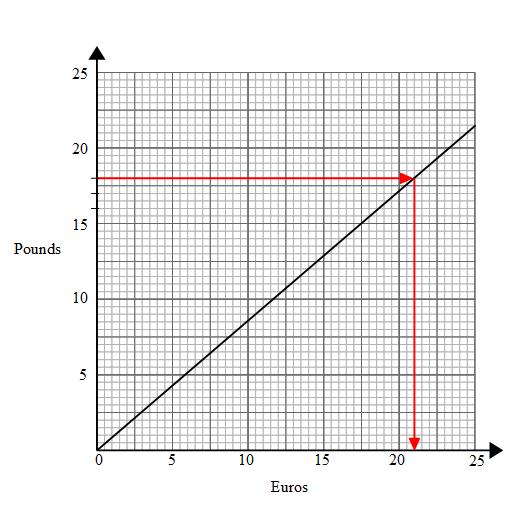
We can now read off the Euros axis.
£18 = €21
We can also be asked to use a conversion graph to convert numbers that are off the chart
Example: Use the conversion graph to convert €80 into Pounds.
The first step would be to use the conversion graph to convert something in Euros into Pounds
If we convert €20 into pounds we could multiply the answer by 4 to get €80
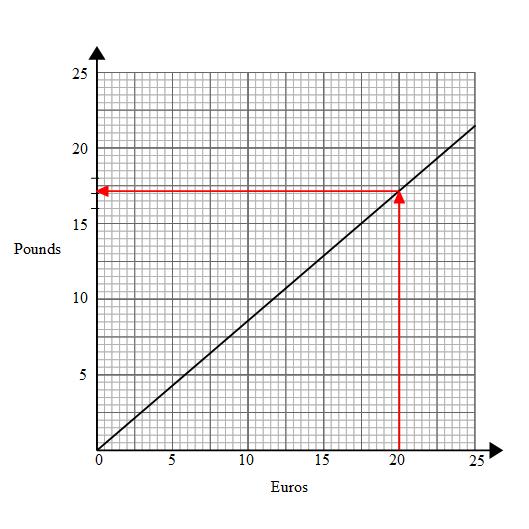
€20 is just over £17
In an exam question there will be a range of answers, anything between £17 and £17.25 should be acceptable.
I will say €20 = £17.10
We can now multiply by 4
4 × €20 = 4 × £17.10
€80 = £68.40
GCSE
Learn GCSE MathsA Level
Learn A Level MathsCopyright © Maths Genie. Maths Genie Limited is a company registered in England and Wales with company number 14341280. Registered Office: 86-90 Paul Street, London, England, EC2A 4NE.