Bar Charts
A bar chart is used to display data visually. The height of each rectangular bar shows the frequency of each category.
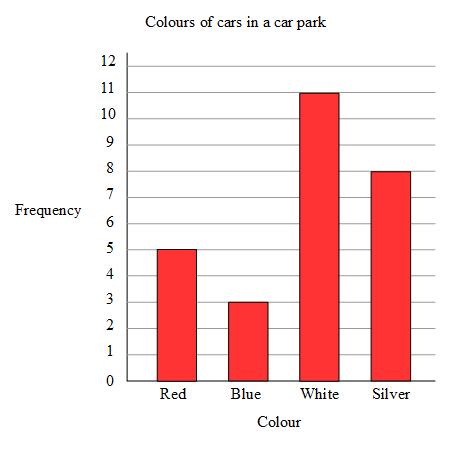
Here is a bar chart showing the colours of cars in a car park:

The different colours are shown on the horizontal axis and the frequency is shown by the height of each bar.
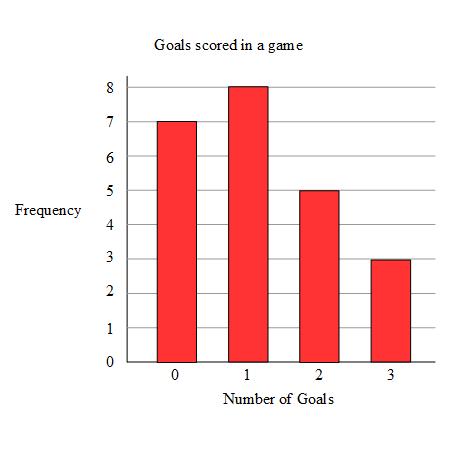
Example 1: Here is a bar chart showing the number of goals scored by a football team in some matches.

a) In how many games did the team score 1 goal?
b) How many games did the team play?
a) The bar for 1 goal goes up to 8, the team scored 1 goal in 8 games
b) To find the number of games played we need to add up all of the frequencies
The team scored 0 goals in 7 games, 1 goal in 8 games, 2 goals in 5 games and 3 goals in 3 games.
7 + 8 + 5 + 3 = 23 games
We can use a dual bar chart (double bar chart) when we can split the categories into groups
Here is a table showing the favourite biscuit of some students:
| Bourbons | Chocolate Digestives | Shortbread | |
|---|---|---|---|
| Boys | 4 | 9 | 7 |
| Girls | 3 | 7 | 10 |
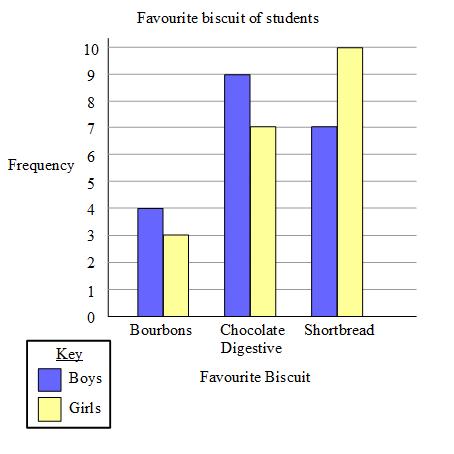
We can show this data on a dual bar chart

Each category (each biscuit) has two bars, one for boys and one for girls.
In a dual bar chart we need a key to show what each of the bars represent.
Try this:
Students were asked to pick their favourite sport out of swimming, cycling and running. The bar chart shows the results.