Revision notes for Edexcel AS Level Maths Hypothesis Testing. Open each subtopic for explanations, worked examples, and summaries of Hypothesis Testing, Finding Critical Values, One-Tailed Tests, and Two-Tailed Tests. Written against the Edexcel AS Level Maths (8MA0) specification, so the content matches what's examinable rather than general Maths background.
Hypothesis Testing
What you'll learn
- How a binomial model is used to test a claim about a probability or proportion.
- How to write null and alternative hypotheses clearly.
- How to use p-values and critical regions to make a decision.
- How to write exam-style conclusions in context.
1. Starting point: binomial probabilities
Before you can do a hypothesis test, you need to be comfortable with binomial probabilities. In this topic, you usually count how many “successes” occur in a fixed number of trials.
Definition
Binomial random variable
-
A binomial random variable counts the number of successes in a fixed number of independent trials.
-
We write X∼B(n,p)X \sim B(n,p)X∼B(n,p), where nnn is the number of trials and ppp is the probability of success on each trial.
-
The binomial model is suitable when there are two outcomes, the probability of success is constant, and the trials are independent.
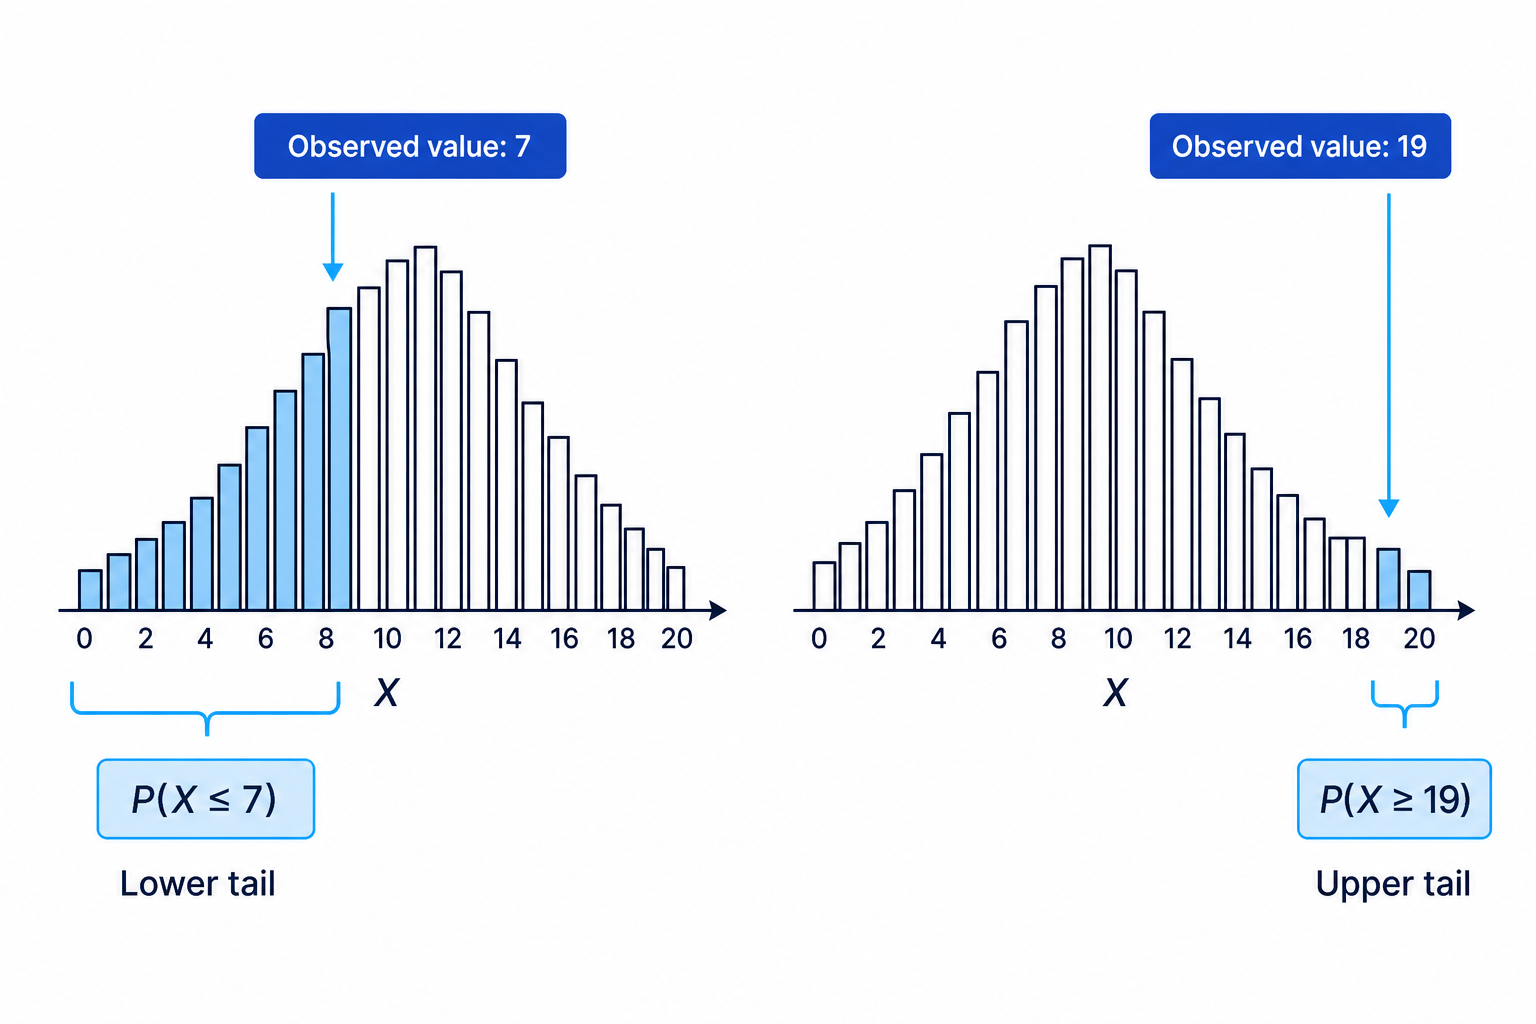
For hypothesis testing, the most important probabilities are cumulative probabilities such as P(X≤7)P(X \le 7)P(X≤7) or P(X≥19)P(X \ge 19)P(X≥19), because we care about results that are “as extreme as” the one observed.
Example
Using binomial probabilities before a test
A student has probability 0.1 of being late on any school day. Over 30 days, let XXX be the number of days the student is late. Find the probability they are late exactly once, fewer than three times, and more than four times.
-
Model the number of late days using a binomial distribution:
X∼B(30,0.1)X \sim B(30,0.1)X∼B(30,0.1) -
For exactly one late day, use the binomial formula:
P(X=1)=(301)(0.1)1(0.9)29≈0.141P(X=1)=\binom{30}{1}(0.1)^1(0.9)^{29}\approx 0.141P(X=1)=(130)(0.1)1(0.9)29≈0.141 -
“Fewer than three” means 0, 1, or 2, so use P(X≤2)P(X \le 2)P(X≤2):
P(X<3)=P(X≤2)≈0.411P(X<3)=P(X\le 2)\approx 0.411P(X<3)=P(X≤2)≈0.411 -
“More than four” means use the complement of P(X≤4)P(X \le 4)P(X≤4):
P(X>4)=1−P(X≤4)≈0.175P(X>4)=1-P(X\le 4)\approx 0.175P(X>4)=1−P(X≤4)≈0.175
Tip
Calculator language
Use binomial PDF for an exact probability such as P(X=5)P(X=5)P(X=5), and binomial CDF for a cumulative probability such as P(X≤5)P(X \le 5)P(X≤5). For upper tails, use a complement: P(X≥6)=1−P(X≤5)P(X \ge 6)=1-P(X\le 5)P(X≥6)=1−P(X≤5).
2. What a hypothesis test is
A hypothesis test is a formal way of deciding whether a sample gives enough evidence to challenge an existing claim.
For binomial hypothesis tests, the claim is usually about a probability or proportion, such as “30% of customers order a starter” or “the probability of a defective item is 0.08”.
Definition
Hypotheses
-
The null hypothesis, written H0H_0H0, is the starting assumption. It usually says the probability has not changed.
-
The alternative hypothesis, written H1H_1H1, is what you are testing for: an increase, a decrease, or a change.
-
The letter ppp represents the true population probability, not the sample proportion.
Common wording:
- “has decreased” means H1:p<p0H_1:p<p_0H1:p<p0.
- “has increased” means H1:p>p0H_1:p>p_0H1:p>p0.
- “has changed” or “is incorrect” means H1:p≠p0H_1:p\ne p_0H1:p=p0.
Example
Writing hypotheses from words
A company claims that 8% of its batteries are faulty. A quality inspector believes the fault rate is higher.
-
Define ppp as the true probability that a battery is faulty.
-
The company’s original claim becomes the null hypothesis:
H0:p=0.08H_0:p=0.08H0:p=0.08 -
The inspector believes the probability is higher, so the alternative hypothesis is:
H1:p>0.08H_1:p>0.08H1:p>0.08 -
This is a one-tailed test because the alternative hypothesis only looks in one direction.
Common Mistake
Hypotheses about the sample
Do not write hypotheses about the observed number in the sample, such as H0:X=3H_0:X=3H0:X=3. Hypotheses are about the true probability ppp.
3. Significance levels and p-values
Definition
Significance level
The significance level is the cut-off probability for deciding whether a result is unusually extreme under H0H_0H0. A 1% test is stricter than a 5% test, so it needs stronger evidence.
Definition
p-value
The p-value is the probability, assuming H0H_0H0 is true, of getting the observed result or something more extreme in the direction of H1H_1H1.
Key Idea
Decision rule
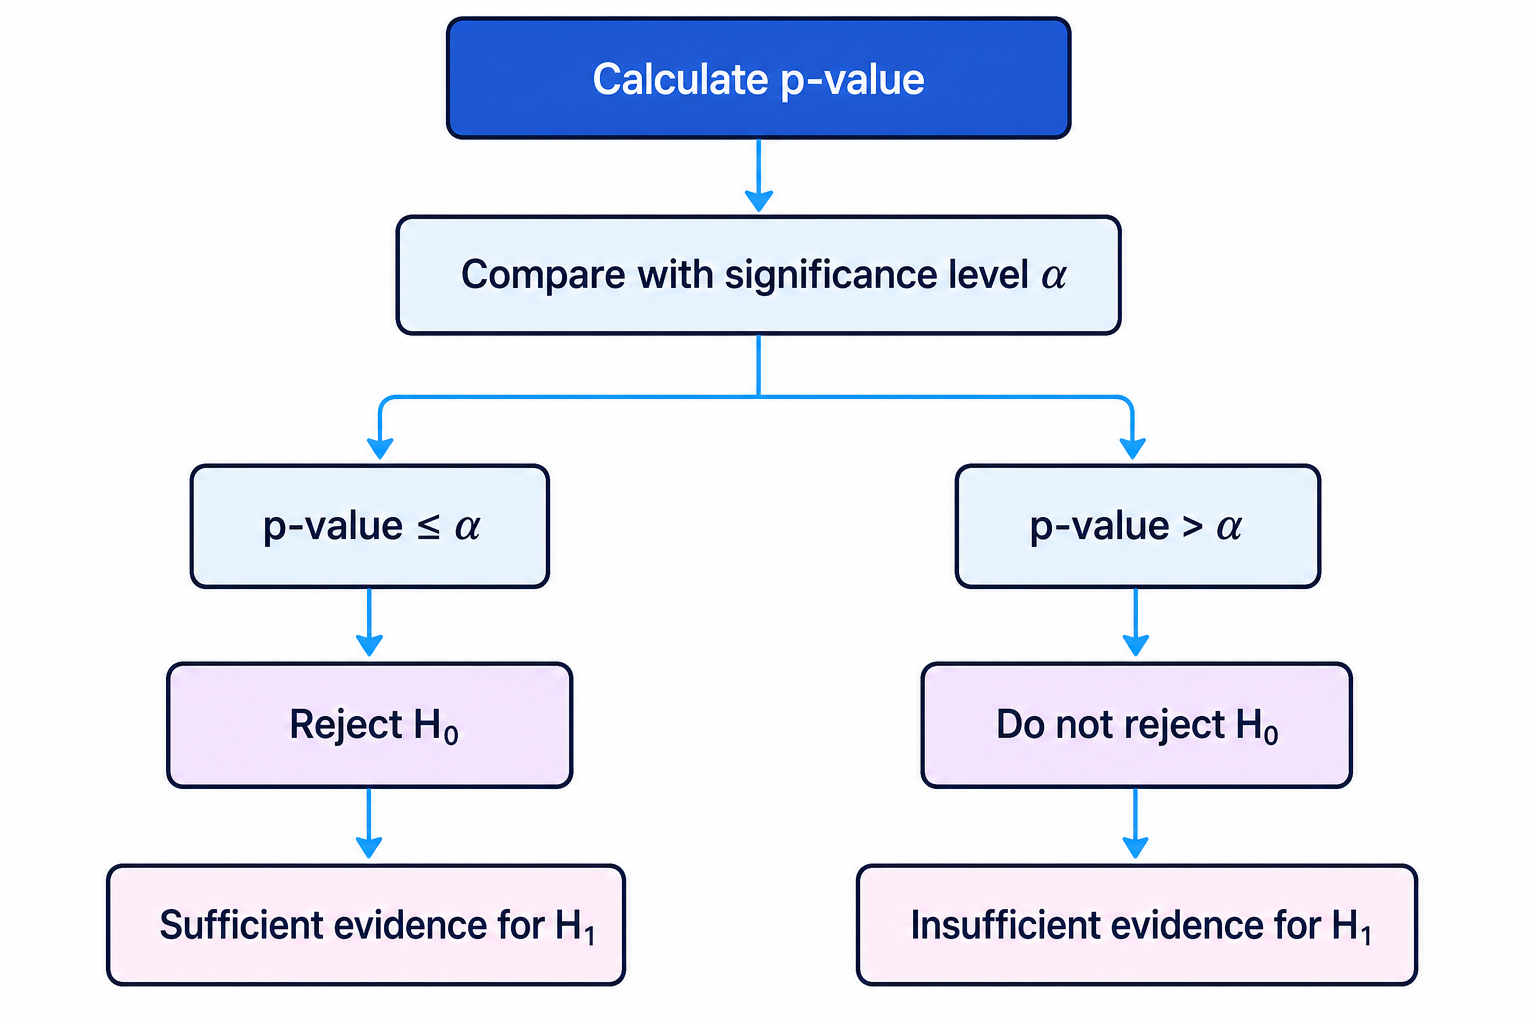
If the p-value is less than or equal to the significance level, reject H0H_0H0. If it is larger, do not reject H0H_0H0.
Testing for a decrease
Example
A lower-tail binomial test
A sandwich shop usually finds that 30% of customers buy a drink. In a random sample of 40 customers, only 7 buy a drink. Test at the 5% significance level whether the proportion has decreased.
-
Define ppp as the true probability that a customer buys a drink, then write the hypotheses:
H0:p=0.30H1:p<0.30H_0:p=0.30 \qquad H_1:p<0.30H0:p=0.30H1:p<0.30 -
Under H0H_0H0, the number of customers buying a drink follows:
X∼B(40,0.30)X \sim B(40,0.30)X∼B(40,0.30) -
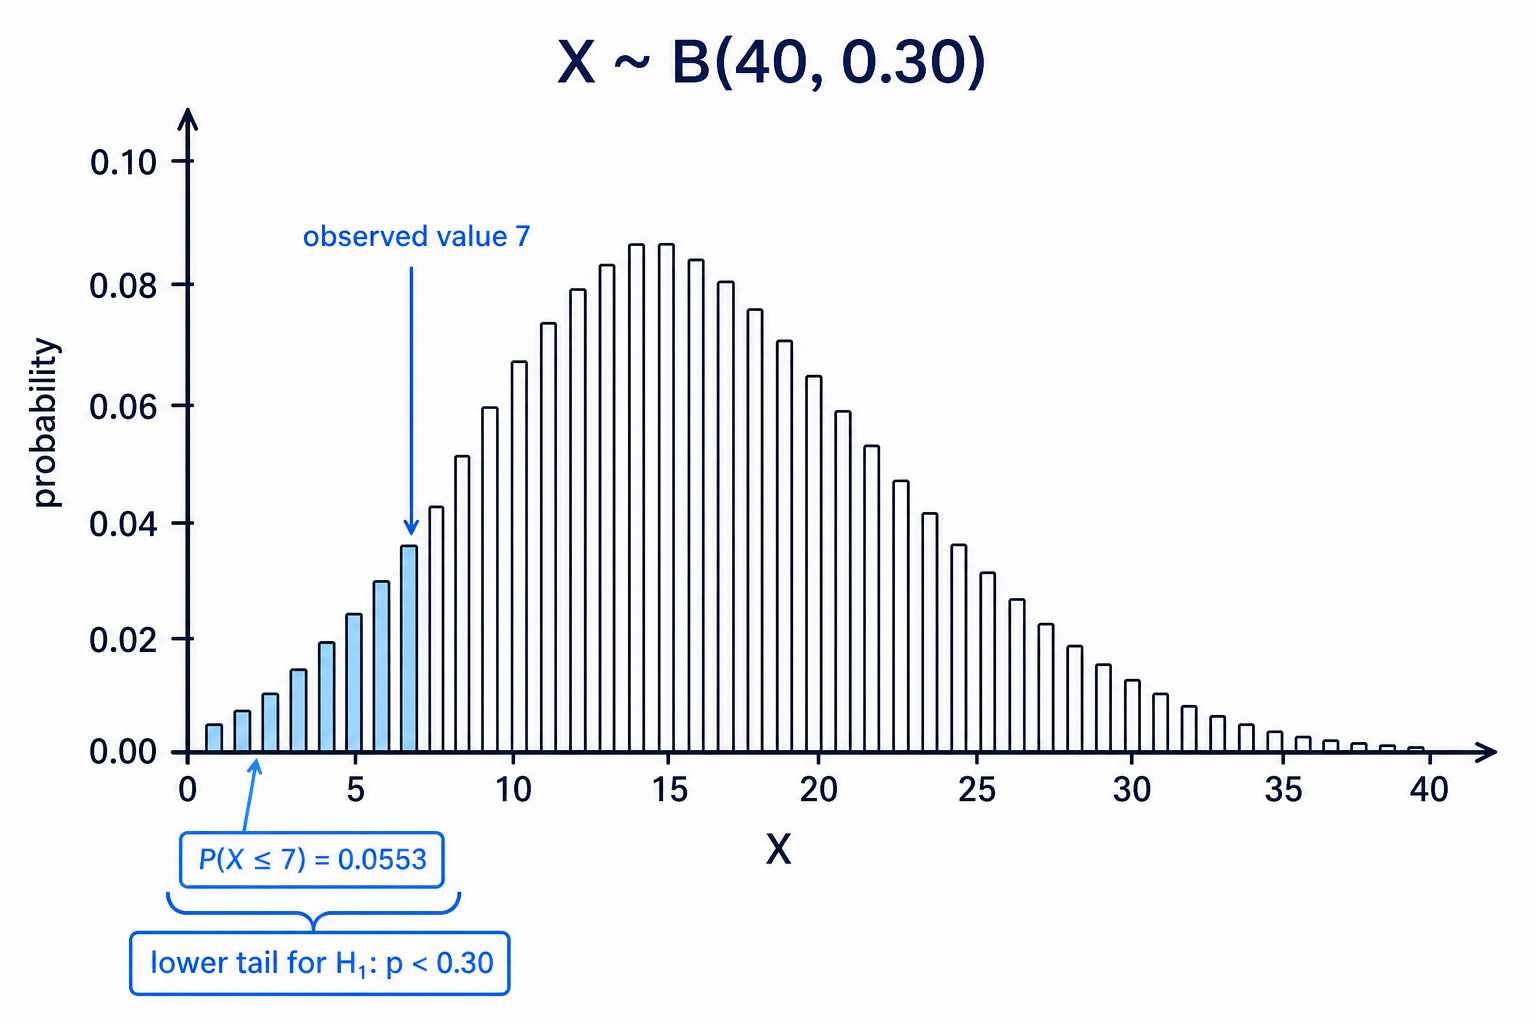
The observed value is 7. Since the test is for a decrease, use the lower tail:
$$
P(X\le 7)\approx 0.0553
$$
4. Compare with the 5% significance level: 0.0553>0.050.0553>0.050.0553>0.05, so do not reject H0H_0H0.
-
There is not sufficient evidence at the 5% level that the proportion of customers buying a drink has decreased.
-
At the 10% level, 0.0553<0.100.0553<0.100.0553<0.10, so you would reject H0H_0H0 and conclude there is sufficient evidence of a decrease.
Common Mistake
Using exactly instead of at least as extreme
In a hypothesis test, do not use just P(X=7)P(X=7)P(X=7). For a lower-tail test, use P(X≤7)P(X\le 7)P(X≤7); for an upper-tail test, use P(X≥7)P(X\ge 7)P(X≥7).
Testing for an increase
Example
An upper-tail binomial test
A café expects 30% of lunch customers to order tea. One day, 19 out of 40 customers order tea. Test at the 1% significance level whether the probability has increased.
-
Define ppp as the true probability that a lunch customer orders tea:
H0:p=0.30H1:p>0.30H_0:p=0.30 \qquad H_1:p>0.30H0:p=0.30H1:p>0.30 -
Under H0H_0H0, model the number ordering tea as:
X∼B(40,0.30)X \sim B(40,0.30)X∼B(40,0.30) -
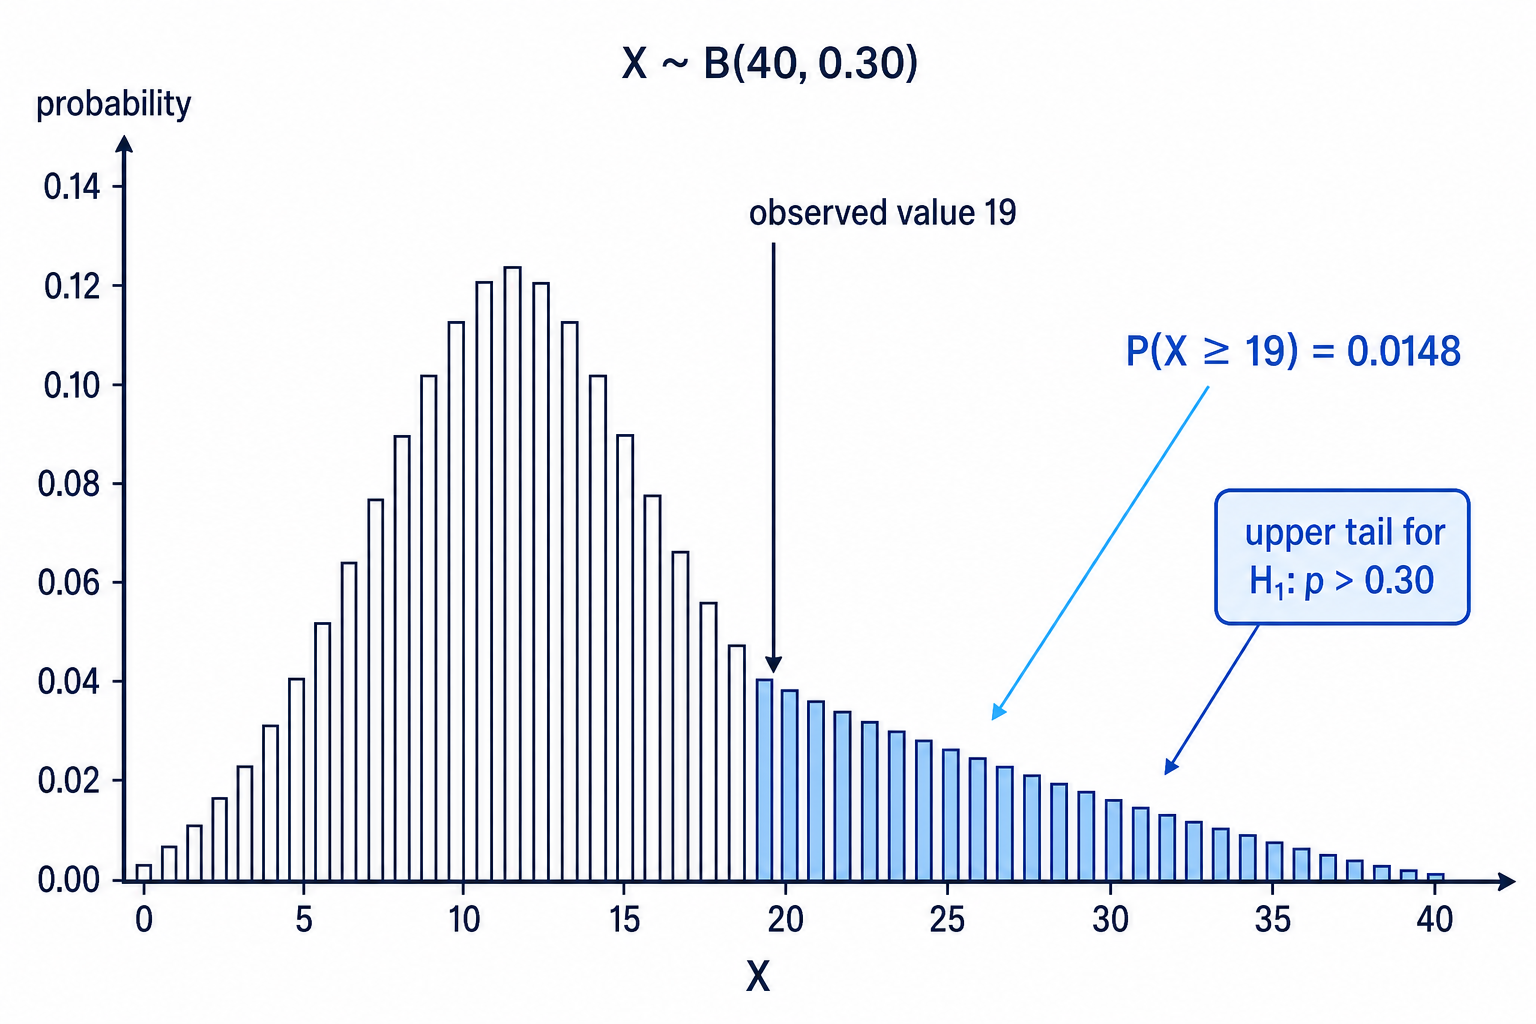
The observed value is 19. Since the test is for an increase, use the upper tail:
$$
P(X\ge 19)\approx 0.0148
$$
4. Compare with the 1% significance level: 0.0148>0.010.0148>0.010.0148>0.01, so do not reject H0H_0H0.
-
There is not sufficient evidence at the 1% level that the probability of ordering tea has increased.
-
If the test used a 5% significance level instead, 0.0148<0.050.0148<0.050.0148<0.05, so you would reject H0H_0H0 at 5%.
Tip
Stricter tests
A result can be significant at 5% but not significant at 1%. Smaller significance levels require more extreme sample results.
4. Two-tailed tests and critical regions
A two-tailed test is used when the alternative hypothesis says the probability has changed, but does not say whether it has increased or decreased.
So if the original claim is p=0.40p=0.40p=0.40, a two-tailed test would use:
H0:p=0.40H1:p≠0.40H_0:p=0.40 \qquad H_1:p\ne 0.40H0:p=0.40H1:p=0.40Definition
Critical region
The critical region is the set of values of XXX that would make you reject H0H_0H0.
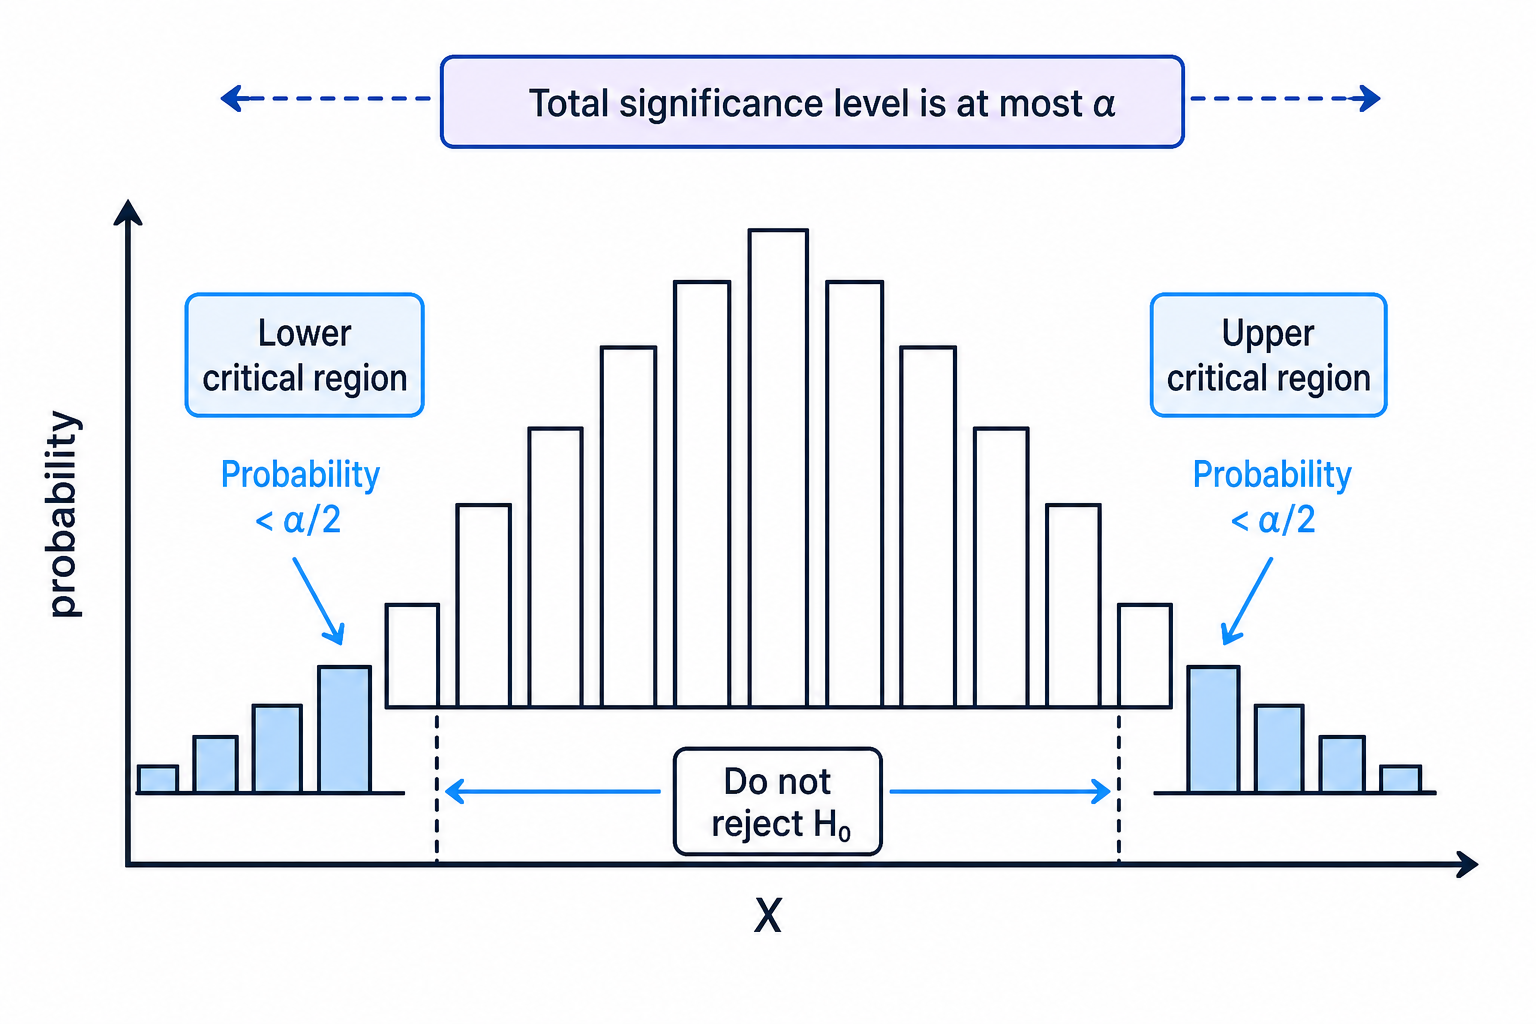
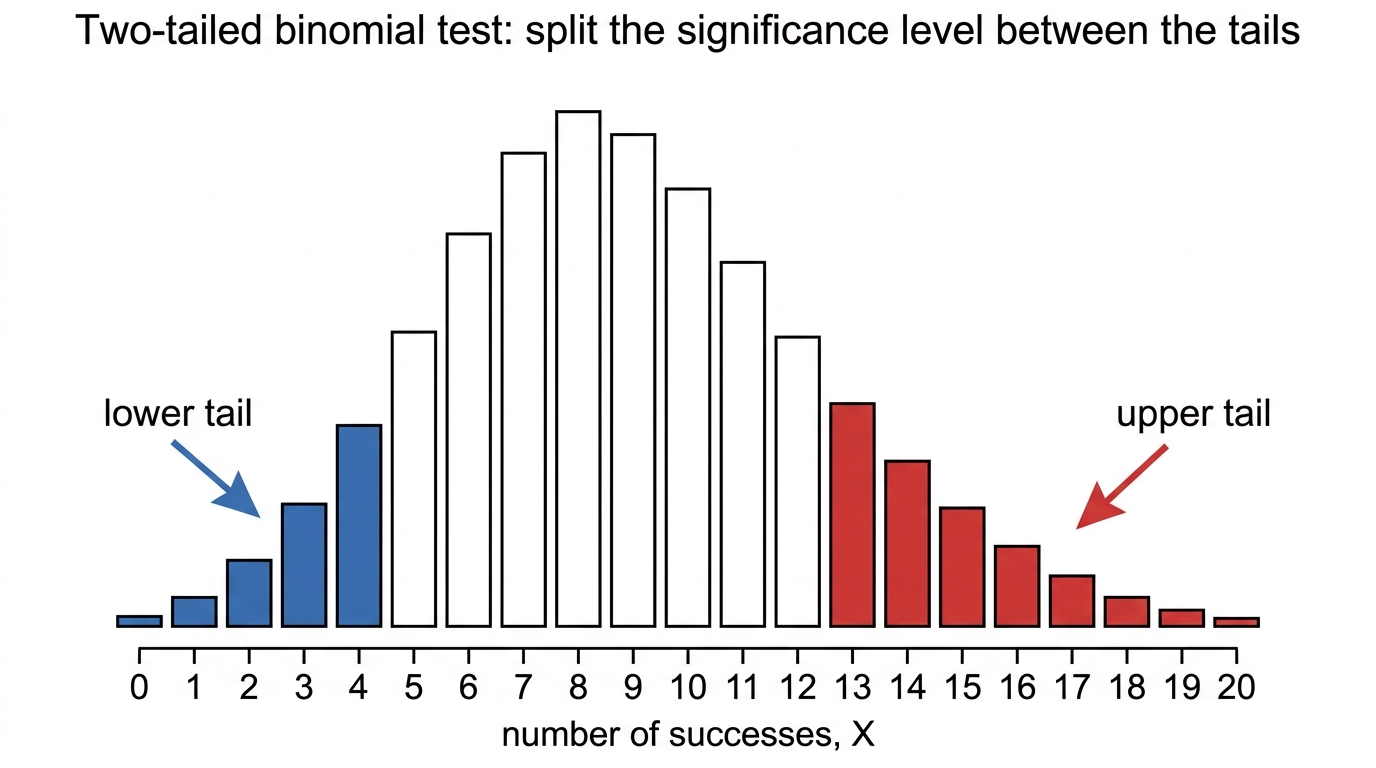
In a two-tailed test, you look for results that are unusually small or unusually large. The diagram shows the idea: the rejection regions are in both tails.
Common Mistake
Binomial tails are discrete
Because XXX only takes whole-number values, you usually cannot make each tail exactly 5%. Choose critical values so that each tail probability is less than the required tail probability.
Example
Finding a two-tailed critical region
A spinner is claimed to land on red with probability 0.4. It is spun 20 times. Find the critical region for a two-tailed test at the 10% significance level.
-
Let XXX be the number of times the spinner lands on red:
X∼B(20,0.4)X \sim B(20,0.4)X∼B(20,0.4) -
Write the hypotheses:
H0:p=0.4H1:p≠0.4H_0:p=0.4 \qquad H_1:p\ne 0.4H0:p=0.4H1:p=0.4 -
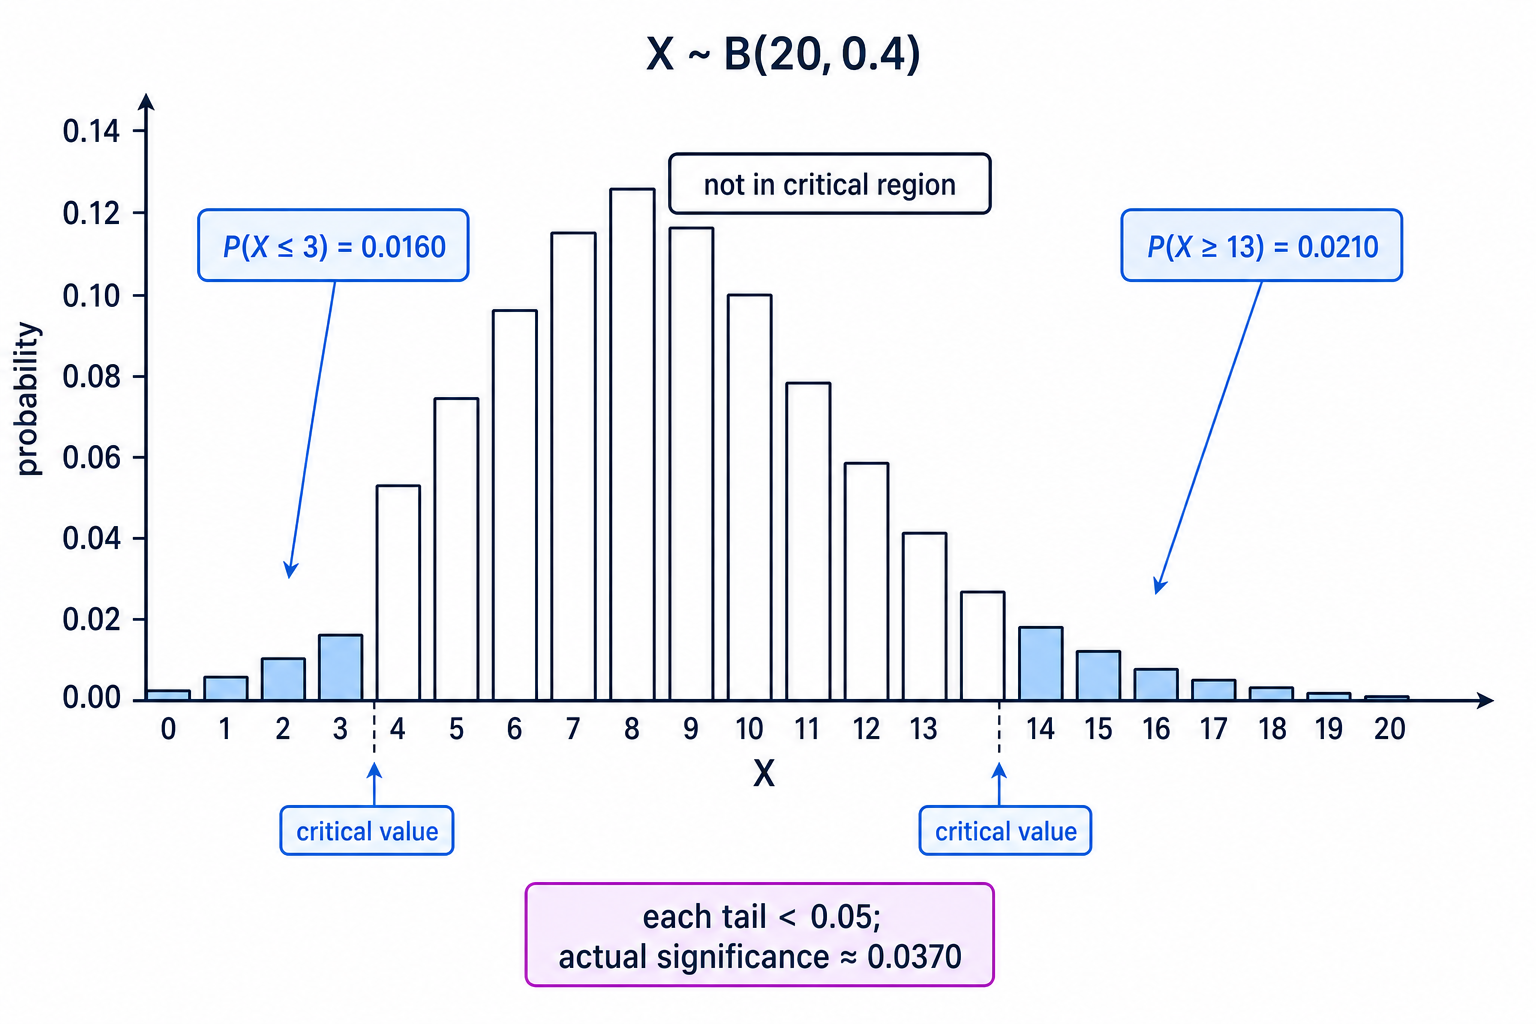
Since the test is two-tailed at 10%, each tail must have probability less than 0.05.
-
For the lower tail, compare cumulative probabilities:
P(X≤3)≈0.0160P(X≤4)≈0.0510P(X\le 3)\approx 0.0160 \qquad P(X\le 4)\approx 0.0510P(X≤3)≈0.0160P(X≤4)≈0.0510 -
Since P(X≤4)P(X\le 4)P(X≤4) is too large, the lower critical region is X≤3X\le 3X≤3.
-
For the upper tail, compare upper-tail probabilities:
P(X≥13)≈0.0210P(X≥12)≈0.0565P(X\ge 13)\approx 0.0210 \qquad P(X\ge 12)\approx 0.0565P(X≥13)≈0.0210P(X≥12)≈0.0565 -
Since P(X≥12)P(X\ge 12)P(X≥12) is too large, the upper critical region is X≥13X\ge 13X≥13.
-
The critical region is therefore X≤3X\le 3X≤3 or X≥13X\ge 13X≥13.
-
The actual significance level is approximately 3.70%, found by adding the two tail probabilities.
-
If the spinner lands on red 13 times, the result is in the critical region, so reject H0H_0H0. There is evidence that the probability of landing on red has changed.
5. Writing conclusions properly
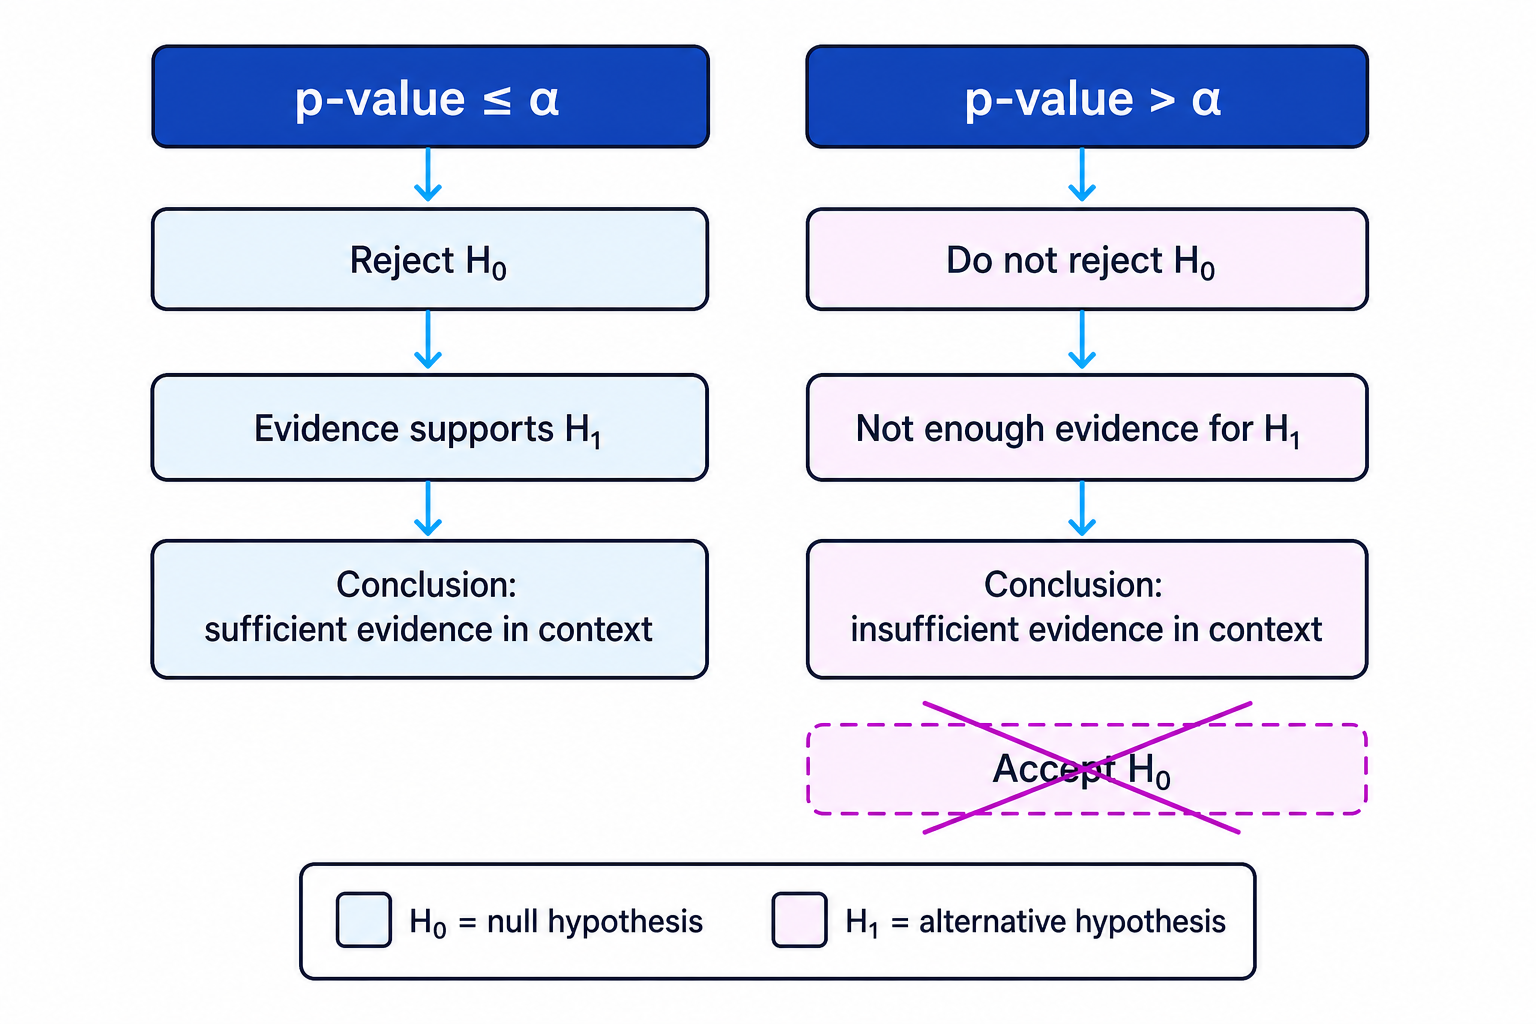
Your final sentence matters. You are not proving that H0H_0H0 is true or false; you are deciding whether the sample gives enough evidence against it.
Example
Choosing the right conclusion
Suppose a test gives a p-value of 0.073 at the 5% significance level, and the alternative hypothesis is that a probability has increased.
-
Compare the p-value with the significance level: 0.073>0.050.073>0.050.073>0.05.
-
Since the p-value is larger than 0.05, do not reject H0H_0H0.
-
The correct conclusion is: there is not sufficient evidence at the 5% level that the probability has increased.
Common Mistake
Saying accept the null hypothesis
Avoid saying “accept H0H_0H0”. Instead, say “do not reject H0H_0H0” or “there is insufficient evidence to support H1H_1H1”.
Exam technique
In the exam
-
Define ppp clearly, then write H0H_0H0 and H1H_1H1 using the wording of the question.
-
Decide the tail before calculating: decreased means lower tail, increased means upper tail, changed means two-tailed.
-
For a p-value test, include the observed value in the tail probability, then compare with the significance level.
-
Write your conclusion in context, using phrases like “sufficient evidence” or “not sufficient evidence”.
Self review
Check yourself
-
If 6 successes are observed and H1:p<p0H_1:p<p_0H1:p<p0, should you calculate P(X=6)P(X=6)P(X=6) or P(X≤6)P(X\le 6)P(X≤6)?
-
What alternative hypothesis would you use for the phrase “the probability is no longer 0.25”?
-
Why might the actual significance level of a binomial critical region be less than the stated significance level?

Recap questions
Test yourself with 5 quick questions on this guide. Answer them all correctly to complete it.